Highlights
Metrix++ is a tool to collect and analyse code metrics. Any metric is useless if it is not used.
Metrix++ offers great usage capabilities and assists with variety of application use cases:
- Monitoring trends on daily basis. In order to take actions or make right decisions earlier.
- Enforcing trends on hourly basis, at every commit of code changes. In order to control quality in time, i.e. when it is not too late to redo.
- Assisiting on per minute basis during code refactoring and code development, where coding and quality standards matter.
The workflow sections below demonstarate basic application usecases.
Languages supported
The tool can parse C/C++, C# and Java source code files. The parser identifies certain regions in the code,
such as classes, functions, namespaces, interfaces, etc. It obviously detects comments, strings and code for preprocessor.
The identified regions form a tree of nested source code blocks, which are refered after and additionally scanned by metrics plugins.
This concept allows to attribute metrics per regions, what gives fine grained data and rich input to analysis tools.
The following example demonstrates regions concept.
| Source code |
Regions tree [type: name: content type] |
// simple C++ code

#include <myapi.h>

// I explain the following class
class MyClass {
public:
    int m_var; // some member

    // I explain the following function
    MyClass(): m_var(0) {
        char str[] = "unused string"

        // nested region for good measure
        struct MyStruct {};
    }

    // Do not judge ugly code below
#define get_max(a,b) ((a)>(b)?(a):(b))
    set_max(int b) {
        m_var = get_max(m_var, b);
    }
};
// this is the last line
|
file: __global__: comment
file: __global__: code
file: __global__: preprocessor
file: __global__: code
    class: MyClass: comment
    class: MyClass: code
    class: MyClass: code
    class: MyClass: code, comment
    class: MyClass: code
        function: MyClass: comment
        function: MyClass: code
        function: MyClass: code, string
        function: MyClass: code
            struct: MyStruct: comment
            struct: MyStruct: code
        function: MyClass: code
    class: MyClass: code
        function: set_max: comment
        function: set_max: preprocessor
        function: set_max: code
        function: set_max: code
        function: set_max: code
    class: MyClass: code
file: __global__: comment
|
Metrics
Metrics highlighed in blue are per file metrics. Other metrics are per region metrics.
Region term is explained in the previous chapter.
| Metric (enable option) |
Brief description |
Motivation |
| std.general.size |
Size of a file in bytes. |
- Monitoring growth of source code base.
- Normalizing other metrics.
- Preventing large files and regions (large things difficult to maintain).
- Predicting delivery dates by comparing
S-shaped code base growth / change curves.
|
| std.code.length.total |
The same as 'std.general.size' metric, but attributed to code regions. |
|
| std.code.lines.total |
Number of non-blank lines of code of any content type (exectuable, comments, etc.) |
|
| std.code.lines.code |
Number of non-blank lines of code excluding preprocessor and comments. |
|
| std.code.lines.preprocessor |
Number of non-blank lines of preprocessor code. |
- Enforcing localisation of preprocessor code in a single place.
- Encouraging usage of safer code structures instead of preprocessor.
|
| std.code.lines.comments |
Number of non-blank lines of comments. |
- Low number of comments may indicate about maintainability problems.
|
| std.code.complexity.cyclomatic |
McCabe cyclomatic complexity metric. |
- Identification of highly complex code for review and refactoring.
- Preventing complex functions (complexity is a reason of many defects and a reason of expensive maintaintenance).
|
| std.suppress |
An option enables collection of Metrix++ suppressions and 2 metrics: 'std.suppress:count' and
'std.suppress.file:count'. The first is number of suppressions per region.
The second is the same but applies for file-scope metrics. |
- Suppressing false-positives.
- Managing the amount of suppressions. Usually there are no false-positives to suppress with the right metric,
but could be exceptions in specific cases. Managing suppressions is about managing exceptions.
If there are many exceptional cases, maybe something is wrong with a metric or an application of a metric.
|
| std.general.procerrors |
Number of errors detected by Metrix++ code parser.
Errors, like mismatched brackets, may result in bad identification of regions. |
- Cleaning up errors to ensure reliable code scanning.
|
| std.general.proctime |
Seconds spent on processing a file. |
- Monitor and profile tool's performance.
|
In order to get the tool working, dowload the archive with the latest stable version
and unpack it to some folder. First run of the tool will trigger the installation within the folder,
where it was launched.
Corresponding checkout from the version control system is the following:
svn checkout svn://svn.code.sf.net/p/metrixplusplus/code/releases/latest Metrix++
In order to checkout the latest version under development, use this command:
svn checkout svn://svn.code.sf.net/p/metrixplusplus/code/mainline Metrix++
Prerequisites
Python Runtime Environment (version 2.7.* or later, version 3.* has not been tested)
License
This program is free software; you can redistribute it and/or modify it
under the terms of the GNU General Public License as published by the
Free Software Foundation; version 3 of the License.
This program is distributed in the hope that it will be useful, but WITHOUT ANY WARRANTY;
without even the implied warranty of MERCHANTABILITY or FITNESS FOR A PARTICULAR PURPOSE.
See the GNU General Public License for more details.
You should have received a copy of the GNU General Public License along with the Metrix++;
if not, contact Project Administrator
The workflow and application usecases are demonstrated using source code of
boost/interprocess library.
Boost versions 1.52 and 1.54 are used and refered below as 'previous' and 'current' accordingly.
Collect data
The first obvious step is to collect the data.
The 'collect' tool has got multiple options to enable various metrics plugins.
Let's collect number of lines of code and cyclomatic complexity metrics
for the previous (1.52.0 version) boost interprocess library. Assuming that 2 versions of boost library
are unpacked in the current working directory:
> cd boost_1_52_0
> python "/path/to/metrix++.py" collect --std.code.lines.code --std.code.complexity.cyclomatic -- boost/interprocess
> cd ../ # return back to working directory
The list of arguments after '--' enumerates paths where to read source files.
As a result of execution of this command, a file metrixpp.db will be written in the current working directory.
It can be redefined with help of --db-file option.
Metrix++ has got rich functionality in comparing code bases and reducing processing scope to modified or new code.
So, let's collect the same data for the current (1.54.0 version) boost interprocess library.
> cd boost_1_54_0
> python "/path/to/metrix++.py" collect --std.code.lines.code --std.code.complexity.cyclomatic -- boost/interprocess --db-file-prev=../boost_1_52_0/metrixpp.db
> cd ../ # return back to working directory
The option --db-file-prev points out to the file with data collected in the previous step.
So, eventually it executed iterative collection. It can speed up the exectuion significantly,
depending on amount of changes between two version.
Check other options of the collect tool by executing:
> python "/path/to/metrix++.py" collect --help
Summary metrics and distribution tables/graphs
It is time to look at the data files collected (step above). The command:
> python "/path/to/metrix++.py" view --db-file=boost_1_54_0/metrixpp.db
prints summary metrics, like minimum/maximum, and distribution/frequency tables:
:: info: Overall metrics for 'std.code.complexity:cyclomatic' metric
	Average        : 0.652902698283
	Minimum        : 0
	Maximum        : 37
	Total          : 1597.0
	Distribution   : 2446 regions in total (including 0 suppressed)
	  Metric value : Ratio : R-sum : Number of regions
	             0 : 0.771 : 0.771 : 1886	|||||||||||||||||||||||||||||||||||||||||||||||||||||||||||||||||||||||||||||
	             1 : 0.110 : 0.881 :  268	|||||||||||
	             2 : 0.044 : 0.925 :  108	||||
	             3 : 0.025 : 0.949 :   60	||
	             4 : 0.016 : 0.966 :   40	||
	             5 : 0.007 : 0.973 :   18	|
	             6 : 0.006 : 0.979 :   14	|
	             7 : 0.004 : 0.983 :   10
	             8 : 0.003 : 0.986 :    8
	             9 : 0.002 : 0.988 :    4
	            10 : 0.004 : 0.991 :    9
	            11 : 0.002 : 0.993 :    4
	            12 : 0.001 : 0.994 :    3
	            13 : 0.001 : 0.995 :    2
	            14 : 0.001 : 0.996 :    2
	         15-16 : 0.001 : 0.997 :    3
	         17-18 : 0.001 : 0.998 :    3
	            20 : 0.000 : 0.999 :    1
	         23-25 : 0.001 : 1.000 :    2
	            37 : 0.000 : 1.000 :    1

:: info: Overall metrics for 'std.code.lines:code' metric
	Average        : 6.64356984479
	Minimum        : 0
	Maximum        : 201
	Total          : 23970.0
	Distribution   : 3608 regions in total (including 0 suppressed)
	  Metric value : Ratio : R-sum : Number of regions
	           0-1 : 0.088 : 0.088 :  319	|||||||||
	             2 : 0.320 : 0.409 : 1155	||||||||||||||||||||||||||||||||
	             3 : 0.108 : 0.517 :  390	|||||||||||
	             4 : 0.081 : 0.598 :  294	||||||||
	             5 : 0.080 : 0.678 :  290	||||||||
	             6 : 0.061 : 0.739 :  220	||||||
	             7 : 0.049 : 0.788 :  176	|||||
	             8 : 0.030 : 0.818 :  109	|||
	             9 : 0.025 : 0.843 :   89	||
	         10-11 : 0.032 : 0.876 :  117	|||
	         12-13 : 0.020 : 0.895 :   71	||
	            14 : 0.012 : 0.907 :   43	|
	         15-16 : 0.017 : 0.924 :   61	||
	         17-19 : 0.015 : 0.939 :   55	||
	         20-22 : 0.013 : 0.952 :   46	|
	         23-26 : 0.011 : 0.963 :   40	|
	         27-30 : 0.009 : 0.972 :   33	|
	         31-39 : 0.009 : 0.981 :   33	|
	         40-65 : 0.009 : 0.991 :   34	|
	        66-201 : 0.009 : 1.000 :   33	|

:: info: Directory content:
	Directory      : .
The same command with --db-file-prev option enables comparision and change trends are shown in [] brackets:
> python "/path/to/metrix++.py" view --db-file=boost_1_54_0/metrixpp.db --db-file-prev=boost_1_52_0/metrixpp.db
:: info: Overall metrics for 'std.code.complexity:cyclomatic' metric
	Average        : 0.652902698283 [+0.00362138411453]
	Minimum        : 0 [+0]
	Maximum        : 37 [+1]
	Total          : 1597.0 [+16.0]
	Distribution   : 2446 [+11] regions in total (including 0 [+0] suppressed)
	  Metric value : Ratio : R-sum : Number of regions
	             0 : 0.771 : 0.771 : 1886 [+5   ]	|||||||||||||||||||||||||||||||||||||||||||||||||||||||||||||||||||||||||||||
	             1 : 0.110 : 0.881 :  268 [+4   ]	|||||||||||
	             2 : 0.044 : 0.925 :  108 [+0   ]	||||
	             3 : 0.025 : 0.949 :   60 [+2   ]	||
	             4 : 0.016 : 0.966 :   40 [-1   ]	||
	             5 : 0.007 : 0.973 :   18 [-1   ]	|
	             6 : 0.006 : 0.979 :   14 [+1   ]	|
	             7 : 0.004 : 0.983 :   10 [+1   ]
	             8 : 0.003 : 0.986 :    8 [+1   ]
	             9 : 0.002 : 0.988 :    4 [+0   ]
	            10 : 0.004 : 0.991 :    9 [-2   ]
	            11 : 0.002 : 0.993 :    4 [+1   ]
	            12 : 0.001 : 0.994 :    3 [+0   ]
	            13 : 0.001 : 0.995 :    2 [+0   ]
	            14 : 0.001 : 0.996 :    2 [+0   ]
	         15-16 : 0.001 : 0.997 :    3 [-1   ]
	         17-18 : 0.001 : 0.998 :    3 [+1   ]
	            20 : 0.000 : 0.999 :    1 [+0   ]
	         23-25 : 0.001 : 1.000 :    2 [+0   ]
	         36-37 : 0.000 : 1.000 :    1 [+0   ]

:: info: Overall metrics for 'std.code.lines:code' metric
	Average        : 6.64356984479 [+0.012181964309]
	Minimum        : 0 [+0]
	Maximum        : 201 [+4]
	Total          : 23970.0 [+223.0]
	Distribution   : 3608 [+27] regions in total (including 0 [+0] suppressed)
	  Metric value : Ratio : R-sum : Number of regions
	           0-1 : 0.088 : 0.088 :  319 [+3   ]	|||||||||
	             2 : 0.320 : 0.409 : 1155 [+9   ]	||||||||||||||||||||||||||||||||
	             3 : 0.108 : 0.517 :  390 [-3   ]	|||||||||||
	             4 : 0.081 : 0.598 :  294 [+7   ]	||||||||
	             5 : 0.080 : 0.678 :  290 [+7   ]	||||||||
	             6 : 0.061 : 0.739 :  220 [-1   ]	||||||
	             7 : 0.049 : 0.788 :  176 [-2   ]	|||||
	             8 : 0.030 : 0.818 :  109 [-1   ]	|||
	             9 : 0.025 : 0.843 :   89 [+4   ]	||
	         10-11 : 0.032 : 0.876 :  117 [+9   ]	|||
	         12-13 : 0.020 : 0.895 :   71 [-9   ]	||
	            14 : 0.012 : 0.907 :   43 [+0   ]	|
	         15-16 : 0.017 : 0.924 :   61 [+0   ]	||
	         17-19 : 0.015 : 0.939 :   55 [+6   ]	||
	         20-22 : 0.013 : 0.952 :   46 [-3   ]	|
	         23-26 : 0.011 : 0.963 :   40 [+2   ]	|
	         27-30 : 0.009 : 0.972 :   33 [-3   ]	|
	         31-39 : 0.009 : 0.981 :   33 [+0   ]	|
	         40-65 : 0.009 : 0.991 :   34 [+1   ]	|
	        66-201 : 0.009 : 1.000 :   33 [+1   ]	|

:: info: Directory content:
	Directory      : .
Reducing analysis scope
There are two ways to reduce the analysis scope for the view tool. The first is to enumerate paths of interest.
For example, the following command reduces scope to 'allocators' sub-directory within the processed code.
> python "/path/to/metrix++.py" view --db-file=boost_1_54_0/metrixpp.db -- ./boost/interprocess/allocators
The second is to specify --scope-mode option, which instructs the tool to process only modified and/or new files/regions.
For example, view the summary metrics for all modified and new regions:
> python "/path/to/metrix++.py" view --db-file=boost_1_54_0/metrixpp.db --db-file-prev=boost_1_52_0/metrixpp.db --scope-mode=touched
:: info: Overall metrics for 'std.code.complexity:cyclomatic' metric
	Average        : 1.84924623116 [-0.0230941943761]
	Minimum        : 0 [+0]
	Maximum        : 37 [+1]
	Total          : 368.0 [+16.0]
	Distribution   : 199 [+11] regions in total (including 0 [+0] suppressed)
	  Metric value : Ratio : R-sum : Number of regions
	             0 : 0.608 : 0.608 : 121 [+5  ]	|||||||||||||||||||||||||||||||||||||||||||||||||||||||||||||
	             1 : 0.131 : 0.739 :  26 [+4  ]	|||||||||||||
	             2 : 0.070 : 0.809 :  14 [+0  ]	|||||||
	             3 : 0.060 : 0.869 :  12 [+2  ]	||||||
	             4 : 0.015 : 0.884 :   3 [-1  ]	||
	             5 : 0.015 : 0.899 :   3 [-1  ]	||
	             6 : 0.005 : 0.905 :   1 [+1  ]	|
	             7 : 0.015 : 0.920 :   3 [+1  ]	||
	             8 : 0.015 : 0.935 :   3 [+1  ]	||
	             9 : 0.010 : 0.945 :   2 [+0  ]	|
	            10 : 0.010 : 0.955 :   2 [-2  ]	|
	            11 : 0.005 : 0.960 :   1 [+1  ]	|
	            12 : 0.005 : 0.965 :   1 [+0  ]	|
	            13 : 0.005 : 0.970 :   1 [+0  ]	|
	            16 : 0.005 : 0.975 :   1 [-1  ]	|
	            17 : 0.005 : 0.980 :   1 [+0  ]	|
	            18 : 0.010 : 0.990 :   2 [+1  ]	|
	            20 : 0.005 : 0.995 :   1 [+0  ]	|
	         36-37 : 0.005 : 1.000 :   1 [+0  ]	|

:: info: Overall metrics for 'std.code.lines:code' metric
	Average        : 15.9645390071 [-0.815853149771]
	Minimum        : 0 [+0]
	Maximum        : 201 [+6]
	Total          : 4502.0 [+223.0]
	Distribution   : 282 [+27] regions in total (including 0 [+0] suppressed)
	  Metric value : Ratio : R-sum : Number of regions
	           0-1 : 0.053 : 0.053 :  15 [+3  ]	|||||
	             2 : 0.124 : 0.177 :  35 [+9  ]	||||||||||||
	             3 : 0.053 : 0.230 :  15 [-3  ]	|||||
	             4 : 0.060 : 0.291 :  17 [+7  ]	||||||
	             5 : 0.089 : 0.379 :  25 [+7  ]	|||||||||
	             6 : 0.060 : 0.440 :  17 [-1  ]	||||||
	             7 : 0.050 : 0.489 :  14 [-2  ]	|||||
	           8-9 : 0.074 : 0.564 :  21 [+3  ]	|||||||
	            10 : 0.035 : 0.599 :  10 [+5  ]	||||
	            11 : 0.082 : 0.681 :  23 [+4  ]	||||||||
	         12-13 : 0.043 : 0.723 :  12 [-9  ]	||||
	         14-15 : 0.039 : 0.762 :  11 [-1  ]	||||
	         16-18 : 0.028 : 0.791 :   8 [+4  ]	|||
	         19-22 : 0.039 : 0.830 :  11 [+0  ]	||||
	         23-26 : 0.039 : 0.869 :  11 [+2  ]	||||
	         27-32 : 0.028 : 0.897 :   8 [-3  ]	|||
	         38-50 : 0.025 : 0.922 :   7 [+0  ]	||
	         51-69 : 0.025 : 0.947 :   7 [+1  ]	||
	        71-100 : 0.032 : 0.979 :   9 [+2  ]	|||
	       101-201 : 0.021 : 1.000 :   6 [-1  ]	||

:: info: Directory content:
	Directory      : .
Detailed metrics per file/region
The same view tool can print detailed metrics per file and per every region in the specified file.
In order to get detailed metrics, enumerate files of interest after '--'. For example:
> python "/path/to/metrix++.py" view --db-file=boost_1_54_0/metrixpp.db --db-file-prev=boost_1_52_0/metrixpp.db -- ./boost/interprocess/detail/managed_open_or_create_impl.hpp
produces output similar to this (truncated to make the page shorter):
./interprocess/detail/managed_open_or_create_impl.hpp:302: info: Metrics per 'priv_open_or_create' region
	Region name    : priv_open_or_create
	Region type    : function
	Offsets        : 8314-14526
	Line numbers   : 301-467
	Modified       : True
	std.code.complexity:cyclomatic: 37 [+1]
	std.code.lines:code: 148 [+4]
More about the viewer
The 'view' command has got an option to alter the output format. It is possible to get the same data
in xml pr python disctionary formats. This can be particularly useful for integration of the tool with
other applications. For example, an editor may re-collect and show context based metrics when a file is saved.
> python "/path/to/metrix++.py" view --db-file=boost_1_54_0/metrixpp.db --format=xml
Check other options of the view tool by executing:
> python "/path/to/metrix++.py" view --help
Apply thresholds
The viewer shows (above) that there are function with quite large value of cyclomatic complexity metric.
Growth of this metric can be considered as negative trend. Metrix++ 'limit' tool offers the capability
to organise the control over trends by applying limits to metric values.
Exceeded limites are alarms in the quality management and control.
Hotspots
Hotspots mode of the limit tool helps to identify top files/regions exceeding a metric threshold.
Let's identify top 3 functions in boost interprocess library, which exceed limit of 15 points of
cyclomatic complexity metric:
> python "/path/to/metrix++.py" limit --db-file=boost_1_54_0/metrixpp.db --max-limit=std.code.complexity:cyclomatic:15 --hotspots=3
./interprocess/detail/managed_open_or_create_impl.hpp:302: warning: Metric 'std.code.complexity:cyclomatic' for region 'priv_open_or_create' exceeds the limit.
	Metric name    : std.code.complexity:cyclomatic
	Region name    : priv_open_or_create
	Metric value   : 37
	Modified       : None
	Change trend   : None
	Limit          : 15.0
	Suppressed     : False

./interprocess/streams/vectorstream.hpp:284: warning: Metric 'std.code.complexity:cyclomatic' for region 'seekoff' exceeds the limit.
	Metric name    : std.code.complexity:cyclomatic
	Region name    : seekoff
	Metric value   : 25
	Modified       : None
	Change trend   : None
	Limit          : 15.0
	Suppressed     : False

./interprocess/streams/bufferstream.hpp:174: warning: Metric 'std.code.complexity:cyclomatic' for region 'seekoff' exceeds the limit.
	Metric name    : std.code.complexity:cyclomatic
	Region name    : seekoff
	Metric value   : 23
	Modified       : None
	Change trend   : None
	Limit          : 15.0
	Suppressed     : False
Controlling trends
Exit code of the 'limit' tool is equal to number of warnings printed. This allows to use the tool
as a static analysis tool during software build process. In this case, non-zero exit code means
that there are violations to the agreed standards and it may fail the build. So, the same command
without --hotspots option will print all regions/files exceeding the specified limit:
> python "/path/to/metrix++.py" limit --db-file=boost_1_54_0/metrixpp.db --max-limit=std.code.complexity:cyclomatic:15
Modes to exclude old code from the considiration
However, it is likely there are many warnings printed in this mode, especially if very old or legacy code is profiled
against new metrics and coding rules. Although all warnings can be removed
by re-factoring in scope of big task force activity, it is where many tools are rejected,
because it is difficult to justify the initial cost of applying and integrating them.
Metrix++ 'limit' tool has got an option --warn-mode, which helps to overcome this problem.
--warn-mode=touched encourages re-factoring only for new and modified regions. It enables
continuous refactoring. It does not matter how late the rule is applied or
coding standard is modified. It is possible to do it anytime with zero initial investment.
For example, applying it to boost interprocess library for a changes between 1.52 and 1.54 versions
results in only 6 warnings:
> python "/path/to/metrix++.py" limit --db-file=boost_1_54_0/metrixpp.db --db-file-prev=boost_1_52_0/metrixpp.db --max-limit=std.code.complexity:cyclomatic:15 --warn-mode=touched
./interprocess/detail/managed_open_or_create_impl.hpp:302: warning: Metric 'std.code.complexity:cyclomatic' for region 'priv_open_or_create' exceeds the limit.
	Metric name    : std.code.complexity:cyclomatic
	Region name    : priv_open_or_create
	Metric value   : 37
	Modified       : True
	Change trend   : +1
	Limit          : 15.0
	Suppressed     : False

./interprocess/ipc/message_queue.hpp:375: warning: Metric 'std.code.complexity:cyclomatic' for region 'insert_at' exceeds the limit.
	Metric name    : std.code.complexity:cyclomatic
	Region name    : insert_at
	Metric value   : 16
	Modified       : True
	Change trend   : 0
	Limit          : 15.0
	Suppressed     : False

./interprocess/mapped_region.hpp:575: warning: Metric 'std.code.complexity:cyclomatic' for region 'mapped_region' exceeds the limit.
	Metric name    : std.code.complexity:cyclomatic
	Region name    : mapped_region
	Metric value   : 18
	Modified       : True
	Change trend   : +2
	Limit          : 15.0
	Suppressed     : False

./interprocess/mem_algo/detail/mem_algo_common.hpp:452: warning: Metric 'std.code.complexity:cyclomatic' for region 'priv_allocate_many' exceeds the limit.
	Metric name    : std.code.complexity:cyclomatic
	Region name    : priv_allocate_many
	Metric value   : 20
	Modified       : True
	Change trend   : 0
	Limit          : 15.0
	Suppressed     : False

./interprocess/mem_algo/rbtree_best_fit.hpp:787: warning: Metric 'std.code.complexity:cyclomatic' for region 'priv_expand_both_sides' exceeds the limit.
	Metric name    : std.code.complexity:cyclomatic
	Region name    : priv_expand_both_sides
	Metric value   : 17
	Modified       : True
	Change trend   : 0
	Limit          : 15.0
	Suppressed     : False

./interprocess/sync/windows/named_sync.hpp:98: warning: Metric 'std.code.complexity:cyclomatic' for region 'open_or_create' exceeds the limit.
	Metric name    : std.code.complexity:cyclomatic
	Region name    : open_or_create
	Metric value   : 18
	Modified       : True
	Change trend   : 0
	Limit          : 15.0
	Suppressed     : False
If it is challenging or not beneficial to refactor everything touched,
--warn-mode=trends simplifies the control over modified regions and only makes sure
that there are no regressions in modified code. In other words, a warning is printed about modified region/file
only if a metric exceeds the specified limit and the value of the metric has got negative trend in modification.
It is possible to apply it anytime with zero initial investment and almost zero on-going investment around old code.
For example, applying it to boost interprocess library for a changes between 1.52 and 1.54 versions
results in only 2 warnings:
> python "/path/to/metrix++.py" limit --db-file=boost_1_54_0/metrixpp.db --db-file-prev=boost_1_52_0/metrixpp.db --max-limit=std.code.complexity:cyclomatic:15 --warn-mode=trend
./interprocess/detail/managed_open_or_create_impl.hpp:302: warning: Metric 'std.code.complexity:cyclomatic' for region 'priv_open_or_create' exceeds the limit.
	Metric name    : std.code.complexity:cyclomatic
	Region name    : priv_open_or_create
	Metric value   : 37
	Modified       : True
	Change trend   : +1
	Limit          : 15.0
	Suppressed     : False

./interprocess/mapped_region.hpp:575: warning: Metric 'std.code.complexity:cyclomatic' for region 'mapped_region' exceeds the limit.
	Metric name    : std.code.complexity:cyclomatic
	Region name    : mapped_region
	Metric value   : 18
	Modified       : True
	Change trend   : +2
	Limit          : 15.0
	Suppressed     : False
--warn-mode=new drops control over existing code and ensures that warnings are only about new code.
For example, applying it to boost interprocess library for a changes between 1.52 and 1.54 versions
results in 0 warnings, so new code is totally compliant with the standard required in the example.
> python "/path/to/metrix++.py" limit --db-file=boost_1_54_0/metrixpp.db --db-file-prev=boost_1_52_0/metrixpp.db --max-limit=std.code.complexity:cyclomatic:15 --warn-mode=new
Suppressions
It is possible to suppress warnings on exceptional basis. Suppressions are collected from comments in code
and used by the 'limit' tool to filter out unnecessary (suppressed) warnings.
It allows to take fine grained control over false-positive warnings, if there are.
In order to suppress a warning:
- per region metrics: put the metrix++ instruction in the comments before the region, for example:
// This function returns string typed
// representation of a name of a color,
// requested by color's id
// metrix++: suppress std.code.complexity:cyclomatic
std::string getColorName(int color_id)
{
	switch (color_id)
	{
	case COLOR_RED:
		return std::string("red")
	case COLOR_GREEN:
		return std::string("green")
	case COLOR_BLUE:
		return std::string("blue")
	/* and so on */
	}
}
per file metrics: put the metrix++ instruction in the comments at the beginning of a file, for example:
//
// This file does processing of colors and brushes
// Copyright is my company, 2013
//
// However, it is too long and big file, and there is no time
// to split it into multiple file, so shut up the metrix++ warnings:
// metrix++: suppress std.general:size
//

std::string getColorName(int color_id)
{
	...
...
activate collection of suppressions:
> python "/path/to/metrix++.py" collect --std.suppress
run the 'limit' tool WITHOUT --disable-suppressions option:
> python "/path/to/metrix++.py" limit ...
Important notice:
- --std.suppress option enables collection of 2 metrics as well: 'std.suppress:count' and
'std.suppress.file:count'. The first is number of suppressions per region.
The second is the same but applies to file-scope metrics.
It allows to manage the amount of suppressions.
Usually there are no false-positives to suppress with the right metric,
but could be exceptions in specific cases. Managing suppressions is about managing exceptions.
If there are many exceptional cases, maybe something is wrong with a metric or an application of a metric.
Two code examples about colors above do not demonstrate the technically exceptional case,
they likely demonstrate a case of a process exception, like "there is no time to do it proper now", or
a case of wrong application of a metric, like "shut up the useless tool". So, be careful.
The 'view' tool shows number of suppressions and its change trends on per metric basis.
Other applications
Checking data file properties
Metrix++ 'info' tool is helpful to check properties of a data file, like settings used to write it,
colected metrics and files processed. For example:
> python "/path/to/metrix++.py" info --db-file=boost_1_54_0/metrixpp.db
boost_1_54_0/metrixpp.db:: info: Created using plugins and settings:
	version        : 1.0
	std.code.complexity:version: 1.1
	std.code.cpp:version: 1.1
	std.code.cpp:files: *.c,*.cc,*.cpp,*.cxx,*.h,*.hh,*.hpp,*.hxx
	std.code.cs:version: 1.0
	std.code.cs:files: *.cs
	std.code.java:version: 1.1
	std.code.java:files: *.java
	std.code.lines:version: 1.1

test_workflow.db:: info: Collected metrics:
	std.code.complexity:cyclomatic:
	std.code.lines:code:

:: info: Processed files and checksums:
	./interprocess/allocators/detail/node_pool.hpp: 0xb099a7c3
	./interprocess/allocators/detail/node_tools.hpp: 0xaaf5044d
	./interprocess/anonymous_shared_memory.hpp: 0x2bf06cb0
	./interprocess/containers/allocation_type.hpp: 0x8e95cda0
	./interprocess/containers/containers_fwd.hpp: 0xa4d0d9f7
	./interprocess/containers/deque.hpp: 0x6dbb77af
	./interprocess/containers/flat_map.hpp: 0x6750338c
	...
Exporting results
Metrix++ 'export' tool exports data files to csv formated files. For example:
> python "/path/to/metrix++.py" export --db-file=boost_1_54_0/metrixpp.db > boost_1_54_0/metrixpp.csv
file,region,type,modified,line start,line end,std.code.complexity:cyclomatic,std.code.lines:code
./interprocess/allocators/detail/node_pool.hpp,__global__,global,,1,110,,0
./interprocess/allocators/detail/node_pool.hpp,boost,namespace,,33,105,,2
./interprocess/allocators/detail/node_pool.hpp,interprocess,namespace,,34,104,,2
./interprocess/allocators/detail/node_pool.hpp,ipcdetail,namespace,,35,103,,4
./interprocess/allocators/detail/node_pool.hpp,SegmentManager,class,,39,72,,16
...
Files with csv format can be opened by applications, like Microsoft Office Excel, with advanced analysis capabilities.
For example, to draw this distribution graph:
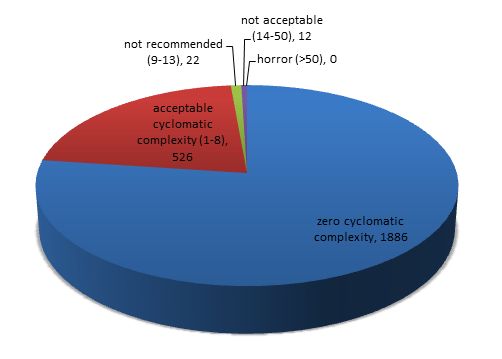
It is not recommended to use export tool to implement custom post-analysis Metrix++ extensions.
The main reason is non granted backward compatibility support for csv columns. Another main reason is that
exporting is relatively slow process. It is recommended to use Metrix++ extensions API instead.
New metric
describe METRIXPLUSPLUS_PATH environment variable
New language
...
New analysis tool
...